Achievement
Created a tool for visualizing the results of machine learning for hazard detection in Veterans' Administration data.
Significance and Impact
This work allows users to quickly and easily identify the geographic location of multiple hazard events detected via machine learning by the Veterans' Administration Automated Surveillance Tool and interact with the results.
Research Details
- Created a visualization of the output of the Veterans' Administration hazard detection system's findings.
- Integrated the visualization into the hazard detection web platform.
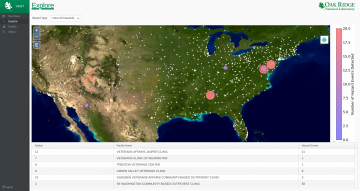
Overview
The Veterans' Administration Automated Surveillance Tool (VA-AST) leverages machine learning for automatic detection of anomalous data within the Veterans' Administration's (VA) records. VA-AST includes an API for detectors to register with the system and begin generating reports of hazards. Each potentially hazardous event detecting is saved in a database. A web based interface is provided for users to control these processes and view information about the potential hazards. One of the ways in which users can interact with the data is through a map which displays all VA facilities and marks the occurrences of hazards that were detected at each. Events are marked by circling the facility with a highlight, which increases in size and changes color as the number of events at that facility increases. The map is implemented through the OpenLayers library in a Vaadin web application that can be accessed through a browser. The map allows the user to control the display of events, such as by viewing only hazards of a certain type. It is further possible to interact with the features on the map and to drill down into individual facilities for a detailed view of and ability to provide feedback for individual hazard events at the facility and provide visualizations of the event data in a statistical process control chart.
Last Updated: January 15, 2021 - 5:03 pm