Project

VISTA Laboratory Research

Project Status: Active

The Visual Informatics for Science and Technology Acceleration (VISTA) Laboratory is actively involved in a number of research projects.  The lab's facilities offer capabilities for building rich telecollaboration environments, immersive virtual- or augmented-reality science visualizations, and scientific visual informatics dashboards.  Come check out the video of our new space.


Video introduction to VISTA.

The VISTA laboratory is an engine for connecting scientists and engineers with complicated data to the tools and techniques that allow them to visualize, re-use, and explore their data sets in new and innovative ways.  The gallery below showcases some of our current efforts.

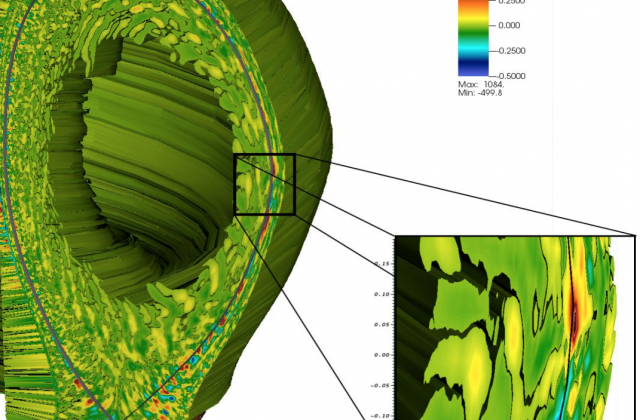
Visualization of plasma at the edge of a Tokamak

This visualization shows the edge-localized structures that emerge due to turbulence in a Fusion Tokamak device.  This picture is by Dave Pugmire, based on data from a simulation with the XGC1 code.

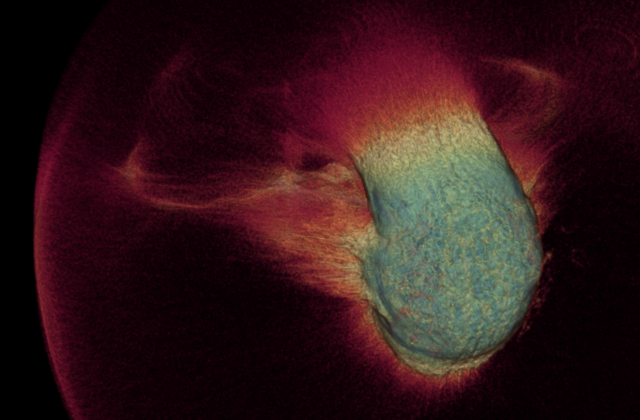
Visualization of proton density field

Proton density field.

Flow lines

The flow lines for this turbulent system are visualized using extensions to VTK-m developed at ORNL by Dave Pugmire and James Kress

One of VISTA's notable community-building activities is the monthly VISTA online seminar series.  This series is for sharing ideas, experiences, and opportunities from one developer to another.  Below is an example from the latest in our series.

Visualization and data analysis are essential components of the scientific discovery process. Presented by Dave Pugmire from ORNL’s Visualization Group for the March 2021 VISTA Webinar series, this tutorial introduces concepts and techniques for data exploration using VisIt, a fully featured, open source, interactive, and scalable tool for visualization, animation, and analysis. VisIt runs across all platforms (Linux, Windows, Mac), as well as being installed on the HPC systems throughout the world.

Last Updated: August 11, 2022 - 5:06 pm