Norbert Podhorszki
Highlights
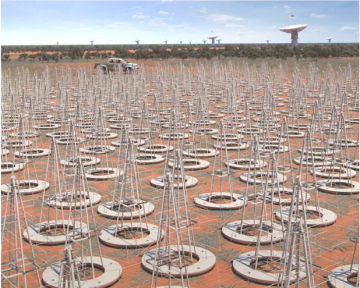
This work presents a workflow for simulating and processing the full-scale low-frequency telescope data of the Square Kilometre Array (SKA) Phase 1. The SKA project will enter the construction phase…
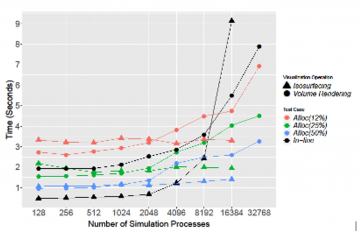
This study considers time-to-solution for two in situ visualization paradigms: in-line and in-transit. It is a follow-on work to two previously published studies. The first study [1] considered time-…
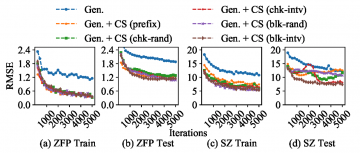
We extract two types of features that impact the overall compression performance: the statistics of data to measure the smoothness of data which is a primary indicator of compressibility and…
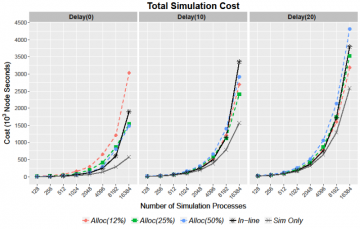
With this work we looked at the overheads of in-transit and in-line visualization at various scales. We demonstrate that in-transit techniques can provide not only a time savings when doing…
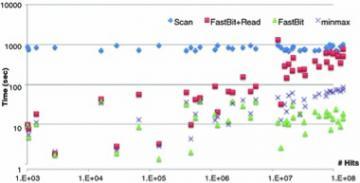
In this paper, we design a query interface for ADIOS to allow arbitrary combinations of range conditions on known variables, implement a number of different mechanisms for resolving these selection…