Achievement
Our team at Oak Ridge National Laboratory (ORNL) developed visualization system for evolutionary neural networks for deep learning. Our visualization system provides a visual analytics environment for evaluating and improving a genetic algorithm that searches for the optimized neural networks. Our system is able to not only visualize how a genetic algorithm traverses a search space, but also allows the users to examine evolving neural networks in-depth and get insights to improve its performance through many interactive visualization components.
Significance and Impact
In evolutionary computation, genetic algorithms and evolutionary strategies are capable of training neural networks with a huge number of parameters. However, the evolutionary process—how crossover and mutation operations assemble the final network—is treated as a black box. Also, examining and tuning the genetic algorithm parameters are also challenging. Our system helps users analyze how a genetic algorithm explores the search space. Our system visualizes the convergence behavior—how a genetic algorithm finds solutions (networks) for a particular problem. The users analyze the relevance of multiple dimensions over the evolutionary process.
Research Details
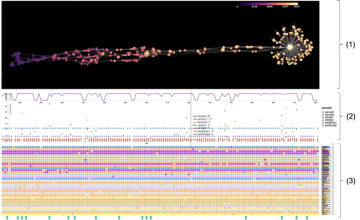
- Our visualization system consists of three major views: a lineage view, a fitness-parameter view, and a network architecture view. The three views visualize different features of the evolutionary process. This allows the results of evolutionary computation to be visualized from different perspectives. Also, the views are connected to each other and provide interactive analysis features.
- The lineage view shows parent-child relationships in the evolution. In this view, we utilize a forced-directed layout to show the lineage, where nodes represent parent/child networks and edges represent their relationships. The central idea of the lineage view is to provide an immediate intuitive understanding of the dynamics of the whole evolutionary process by combining other features of evolutionary computation. The dynamics of evolution are represented as an ancestry tree while we integrate other features into the tree.
- The fitness-parameter view shows the changes in fitness and hyper-parameters of the networks as evolution progresses. The view allows the users to interactively explore and compare how fitness and selected hyperparameter values of networks change over the course of evolution. We need an efficient method to find an appropriate set of hyper-parameters in searching a high-dimensional hyper-parameter space. When we use the approach based on evolution, an analogy between fitness and hyper-parameters is helpful in finding appropriate hyperparameter sets.
- The network architecture view shows how the layers of each network are stacked and how the network architectures converged as evolution progresses. The major goal of the network architecture view is to explore evolution of the network architectures—how the layers of each network are arranged and how the network architectures are converged over evolution progress. In this view, users can focus on network architectures rather the hyperparameters for layers. The search space of the genetic algorithm includes the arrangement of layers within a network as well. The network architecture is one of the most important aspects that affect the performance of convolutional neural network models.
- The views are tightly connected to each other and provide interactive user interfaces for analysis. The system allows users to link over the three views in order to understand the evolutionary process better through interacting with the presented data through different representations. The interaction techniques of the views, such as exploration, filter, selection, and reconfigure, overcome the limitation of static representations and support to uncover insights.
Citation and DOI
Junghoon Chae, Catherine D. Schuman, Steven R. Young, J. Travis Johnston, Derek C. Rose, Robert M. Patton, Thomas E. Potok. "Visualization System for Evolutionary Neural Networks for Deep Learning" IEEE Big Data 2019.
Overview
Deep learning is actively used in a wide range of fields for scientific discovery. To effectively apply deep learning to a particular problem, it is important to select an appropriate network architecture and other hyper-parameters (at each layer). Evolving architectures and hyper-parameters using a genetic algorithm is one current approach to search the huge space of all possible configurations to find those more optimal for the problem. However, examining an evolutionary process and tuning the genetic algorithm are challenging, pushing most users to treat the process as a black box. To address this challenge, we propose a visualization system for evolutionary neural networks for deep learning. The key feature of our visualization system is to provide a visual analytics environment for evaluating a genetic algorithm in order to improve the underlying operations to reduce time to find good solutions. Our system is able to not only visualize how a genetic algorithm traverses its search space but also allows users to examine evolving networks in-depth to get insights to improve performance through interactive visualization components.
Last Updated: January 14, 2021 - 8:30 pm